The brand new version of Locus GIS that has just left our dev environment brings a few significant improvements. For the first time in its history, you can add elevation to your work with objects and projects. For better utilization of received GPS data, we added position averaging. And lastly, the whole project can now be exported for further processing or cooperation.
Elevation
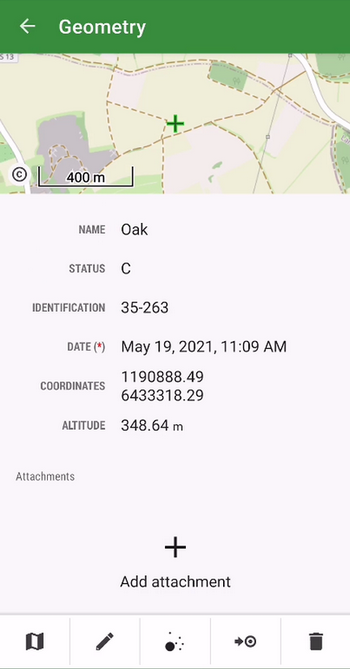
The location of the mapped objects can now be defined by a “third coordinate” – elevation. All new projects now work with this parameter which is either computed from GPS data, can be added manually, or can be added to the items from our global DEM. The elevation values can be also exported to a Shapefile.
Better positioning accuracy
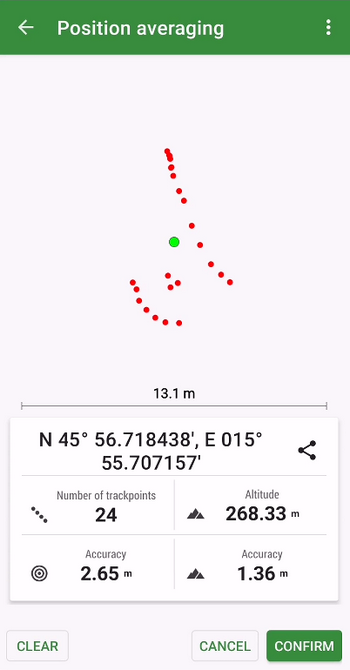
The app can locate objects with enhanced accuracy using position averaging. The device sends a cluster of location data to the app and Locus GIS can calculate the average (the most accurate) location.
Whole project import/export
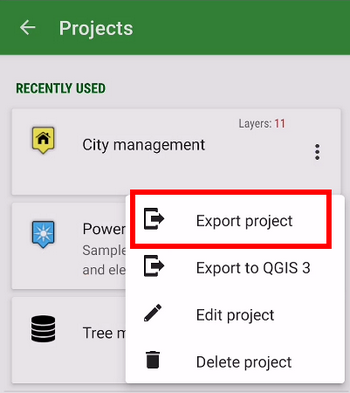
To transfer a whole project easily from one to another device or among more members of one team, we implemented an option to export/import the whole project in a .ZIP file.
We haven’t informed you of what we’ve improved at Locus GIS in recent months. So we’re bringing you a small autumn summary of the most important adjustments that make working with your favorite tool even more efficient.
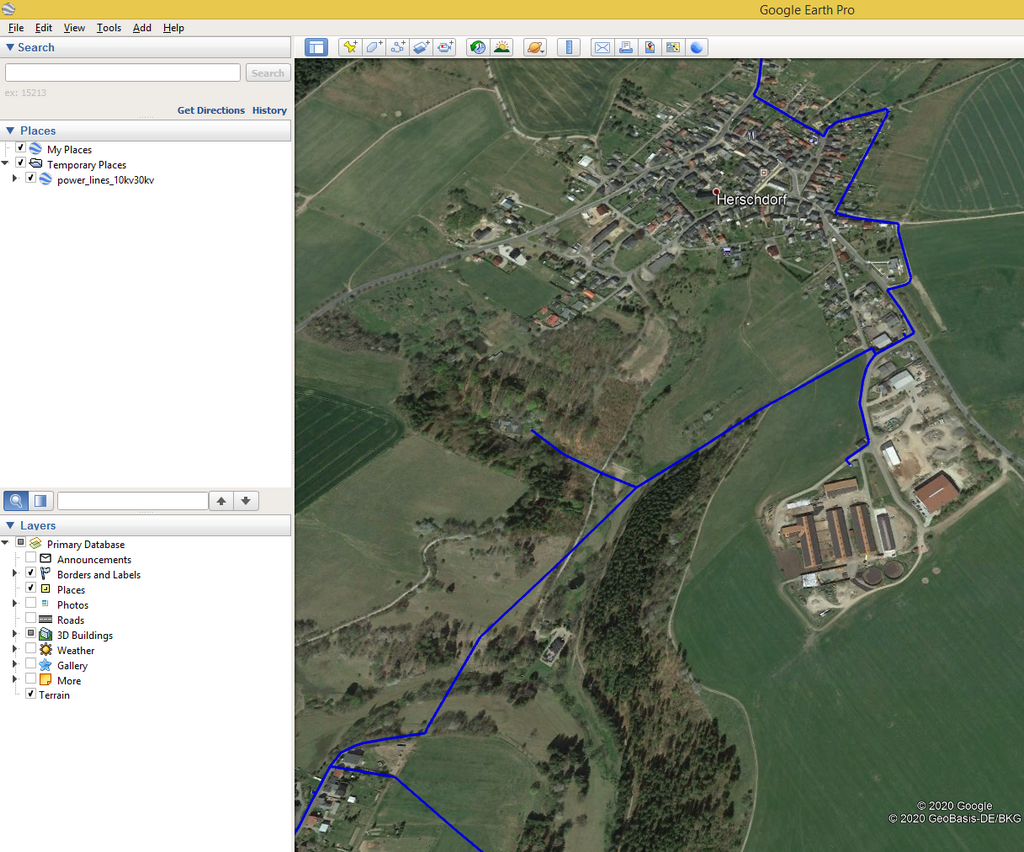
Export measurements from the field to KML
If you use Google Earth or another KML program in your work, you will certainly welcome the ability to export your data to this format. In the new version, you can export both data and attachments.
Faster mapping in the field
We know that the simplest possible workflow is crucial when collecting data in the field. Therefore, we have made several adjustments in the application that will further facilitate your activity:
- we added the ability to change the order of attributes in the table. This way you can customize the form with attributes to best suit your needs:
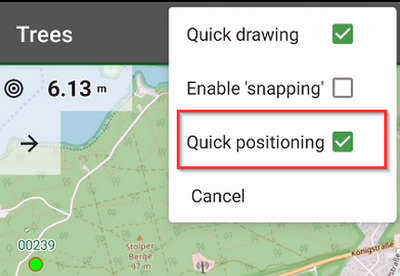
- “quick positioning” – if you are mapping mainly point elements and objects, you may have been delayed in the past by additional confirmation of the position of the point. In the new version, we bring you the choice of position without confirmation – you simply select the position of the point and immediately go to the form for entering attributes
- for better orientation in the field, you can display the “direction of view“, ie a graphical representation of the rotation of your device. The function uses data from the hardware compass and other position sensors of the phone or tablet (you can find it in the map settings > auxiliary graphics).
Advanced styling options
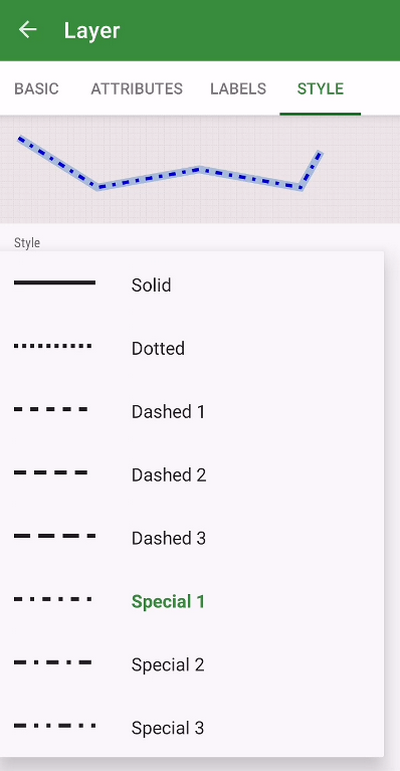
Many projects contain a number of types of data objects, which implies the need to properly distinguish these objects on the map. Styling is used for this – setting graphic parameters of lines, points, and polygons. The new version of the application brings additional options for defining styles:
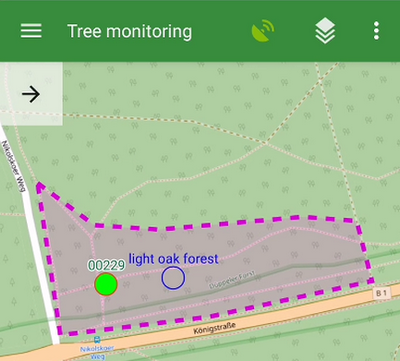
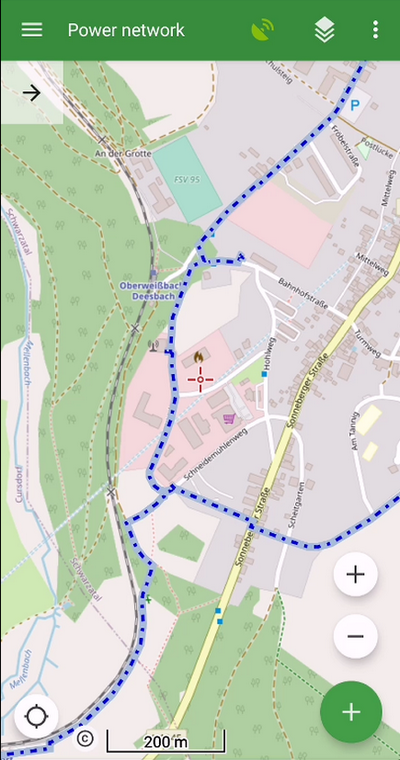
- you can now set different types of polygon lines or contours
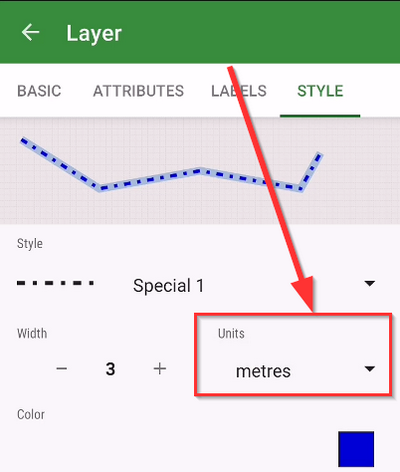
- a useful novelty is the ability to define the size of the symbol and the thickness of the lines in meters. The style can thus correspond to the actual size of the object in the terrain
We hope that these improvements will be useful for your work. We look forward to your opinions and comments.
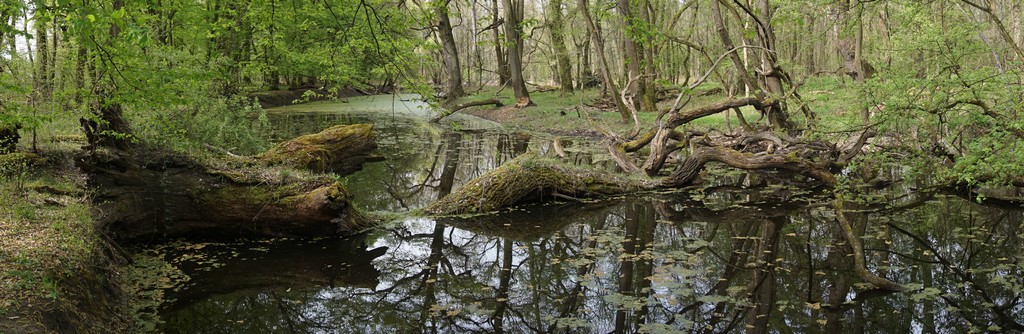
Typical mosquito hatchery – shallow blind arm of the river
We’ve emphasized many times that Locus GIS is a universal helper. Geodata collection is needed in a wide range of fields, from industry, via agriculture to scientific research. We’ve recently received an interesting study in the field of environmental monitoring, in which Locus GIS played a major role.
Slovak zoologist researcher, Mgr. Ján Svetlík, in the years 2018-2019 he devoted himself to field research of the area PLA Záhorie along the river Morava. The aim of the project was to map existing and potential mosquito hatcheries to evaluate more effective biological control of insects in order to reduce the use of chemical insecticides. The monitored area of 137 km2 stretches along 48 km of the river and is therefore quite large for research. In addition, very rich in habitat. It was necessary to identify the boundary of the river inundation, to explore the area in the immediate vicinity of the flood dam, and to map the remnants of floodplain forests with dead branches.
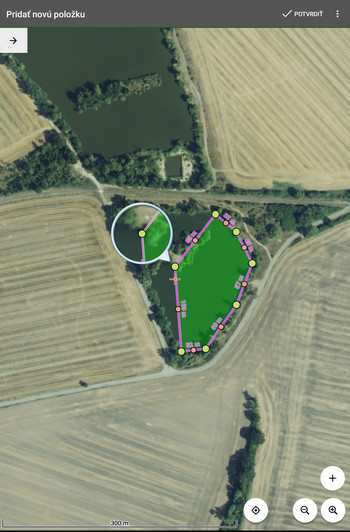
Manual drawing of a polygon of water surface
Mgr. Svetlík used Locus GIS on the Lenovo Yoga tablet, which is characterized by relatively good battery life and a decently accurate GPS + GLONASS chip. When collecting data in challenging wetland terrain, he used tracing of hatchery polygons using motion recording, their manual plotting directly on the display, and their sorting by attribute table.
Mapping large bodies of water using motion recording and subsequent graphical highlighting
Unfortunately, the survey showed a long-term trend of water disappearing from the landscape. The mapping was based on orthophotographic maps from years abundant to precipitation totals. In reality, however, many bodies of water have shrunk considerably or disappeared completely, overgrown with invasive vegetation. The boundary of the inundation then had to be determined according to secondary traces, such as deposits of rubbish once brought by the river during a flood, or according to beaver chippings.
Water in the landscape disappears – comparison of 2012 and 2018
439 hatcheries with a total area of 5.94 km2 were mapped, the largest of which was over 25 hectares. Almost 70% of the area of hatcheries covers the area where biological protection overlaps with the interests of state nature protection. Here, it will be necessary to set priorities in detail so as to maintain a balance for mutual satisfaction on the part of local residents and the nature conservationists. The study also revealed other needs for the continuation of the survey in the next stage – the need to map the sources and routes of hatchery filling with water, to cover shallow habitats that cannot be detected without the presence of water.
Graphical representation of the overlap of mapped localities with nature protection zone
Locus GIS will be there again.
Your projects work with layers of maps and geodata. Collecting the data requires precious work with attributes of collected features. Their proper and reasonable definition, correct distribution, etc. The better described and attributed features, the more quality data you collect and put out for further processing.
Properly attributed features can bear even more detailed information. To specify features in the field, Locus GIS offers attachments, added to the attributed feature. These attachments can be photos, voice recordings, video recordings, and your own sketches.
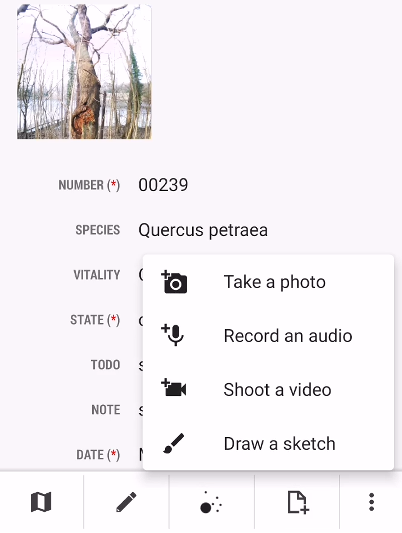
Add a photo
Photos are very useful when you need to report or record the external appearance of various items, or their progress or development in a longer period of time. Do you need to catch the state of plants in the city park? Deterioration or damage to a municipal facility? Benches, lamps, etc. Find the item of your survey in the data layer and add a photo of its actual state. Any photo documentation has a better information value than the best text description.
Add audio or video recording
An audio note is a very fast way how to catch an idea, to describe some property or ongoing status. Later, in your office, you can use it for a more complex description of the feature. Video can describe any progressive action or development, when necessary.
Draw a sketch
The features can be supplemented also by sketches. Sketching is a great tool for emphasizing various details, adding your personal point of view, and all possible markings. They are very useful in geology or archaeology. In Locus GIS, you can either draw the sketch on an empty background, on a screenshot of the map with the feature,
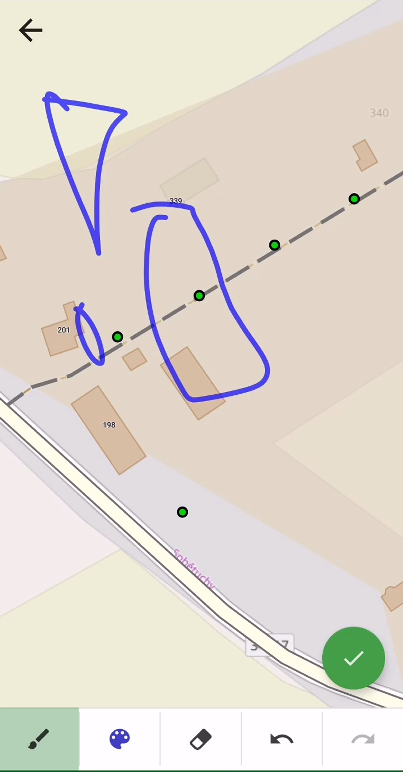
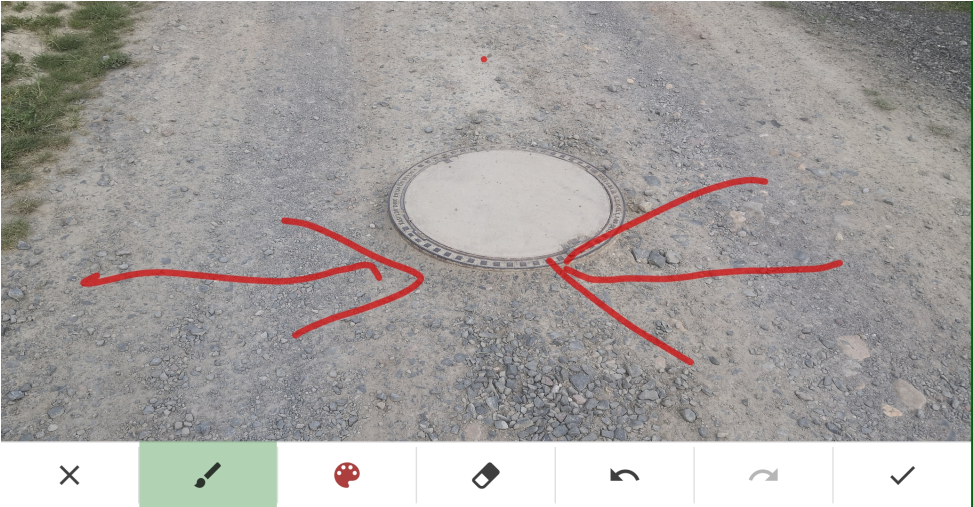
or on a freshly taken photo of the feature.
The process of adding an attachment is pretty simple.
- select the feature
- tap “attachments” button in the bottom bar menu
- select the type of attachment
Adding a sketch is simple too. Check the procedure how to add a sketched photo:
The attachment previews are part of the feature detail box.
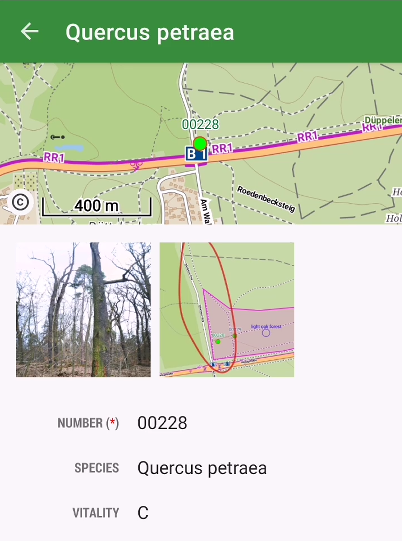
Tapping the thumbnails enlarges the attachment for full-size viewing. In the feature edit detail, you can delete them or edit their titles.
We hope you will use attachments to enrich the information value of all your projects. Enjoy your work!