With Locus GIS for effective application of biological regulation of mosquito populations
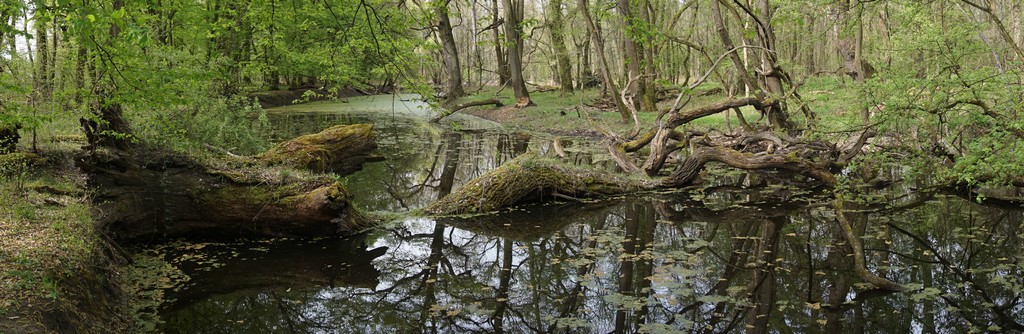
Typical mosquito hatchery – shallow blind arm of the river
We’ve emphasized many times that Locus GIS is a universal helper. Geodata collection is needed in a wide range of fields, from industry, via agriculture to scientific research. We’ve recently received an interesting study in the field of environmental monitoring, in which Locus GIS played a major role.
Slovak zoologist researcher, Mgr. Ján Svetlík, in the years 2018-2019 he devoted himself to field research of the area PLA Záhorie along the river Morava. The aim of the project was to map existing and potential mosquito hatcheries to evaluate more effective biological control of insects in order to reduce the use of chemical insecticides. The monitored area of 137 km2 stretches along 48 km of the river and is therefore quite large for research. In addition, very rich in habitat. It was necessary to identify the boundary of the river inundation, to explore the area in the immediate vicinity of the flood dam, and to map the remnants of floodplain forests with dead branches.
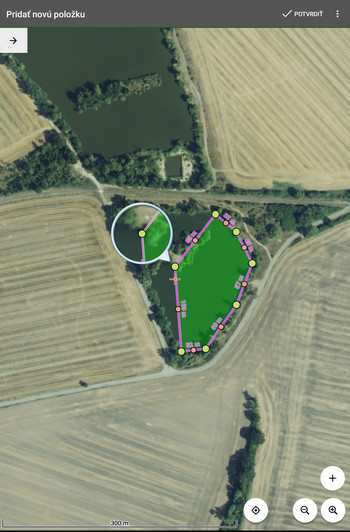
Manual drawing of a polygon of water surface
Mgr. Svetlík used Locus GIS on the Lenovo Yoga tablet, which is characterized by relatively good battery life and a decently accurate GPS + GLONASS chip. When collecting data in challenging wetland terrain, he used tracing of hatchery polygons using motion recording, their manual plotting directly on the display, and their sorting by attribute table.
Mapping large bodies of water using motion recording and subsequent graphical highlighting
Unfortunately, the survey showed a long-term trend of water disappearing from the landscape. The mapping was based on orthophotographic maps from years abundant to precipitation totals. In reality, however, many bodies of water have shrunk considerably or disappeared completely, overgrown with invasive vegetation. The boundary of the inundation then had to be determined according to secondary traces, such as deposits of rubbish once brought by the river during a flood, or according to beaver chippings.
Water in the landscape disappears – comparison of 2012 and 2018
439 hatcheries with a total area of 5.94 km2 were mapped, the largest of which was over 25 hectares. Almost 70% of the area of hatcheries covers the area where biological protection overlaps with the interests of state nature protection. Here, it will be necessary to set priorities in detail so as to maintain a balance for mutual satisfaction on the part of local residents and the nature conservationists. The study also revealed other needs for the continuation of the survey in the next stage – the need to map the sources and routes of hatchery filling with water, to cover shallow habitats that cannot be detected without the presence of water.
Graphical representation of the overlap of mapped localities with nature protection zone
Locus GIS will be there again.

Comments
0